|
SINGLE WELL RESPONSE TESTS
a.k.a. Slug Tests
|
The
previous newsletter
discussed some basic concepts of pumping tests, which are used for
estimating hydraulic parameters in the large scale. In this
newsletter we will discuss single well response tests, otherwise known
as slug tests, which are used for in-situ estimation of hydraulic
parameters at an intermediate to small scale.
Many people consider pumping
tests and slug tests to be very similar, if not essentially the same,
however, there are inherent differences between the two. This newsletter
will highlight some of the features of slug tests which differentiate
it from other aquifer tests.
1. What is a slug
test?
2. What are the benefits
of a slug test?
3. What are some
problems/limitations of slug tests?
4. What are some types
of slug tests analysis methods?
Back to top of
Newsletter
|
|
1. What
is a slug test?
A slug test, as mentioned
previously, is a test used for estimating hydraulic parameters at
intermediate to small scales. In a slug test a known volume (of
water or other material) is rapidly taken out of or put into the
monitoring well. The rate at which the water level falls or
rises is measured while the system equilibrates, and then the data is
analyzed by an appropriate method to determine
hydraulic parameters such as transmissivity and storativity.
Back to
Slug Tests |
|
2. What
are the benefits of a slug test?
There are several benefits of
slug tests. Some of them include:
-
point values of K can be
determined to analyze spatial variability
-
can be conducted accurately
in low-K (conductivity) materials
-
can be used to design full
scale pumping tests
-
more economical and efficient
than a pumping test (only uses one well; cost of disposing of
contaminated water is significantly reduced since volume of water
pumped is reduced in a slug test; etc.)
Back to
Slug Tests |
|
3. What
are some problems/limitations of slug tests?
While there are benefits to
slug tests, there are also problems/limitations. Some of these
include:
-
human error in measurement
due to a rapid response of the water table
-
degree of well development
(under developed: fines brought into the screen and changes
the K; over developed: high K region around the well)
-
leaks in the casing
-
water table fluctuations
(especially in low K areas where recovery takes a long time)
-
skin effect (side wall
alteration from well installation)
Back to
Slug Tests
|
|
4. What
are some types of slug tests analysis methods?
There are several different
methods of analyzing slug test data. Some of these methods are
discussed below.
1) Hvorslev Method (1951)
-
most commonly used
-
developed for a variety of well
geometries
-
can be applied to various
hydrogeologic conditions (confined, unconfined, etc.)
-
accounts for anisotropy
-
formation storage is ignored
-
approximate solution
2) Bouwer and Rice Method
(1976)
-
designed for vertical screens
only - one shape factor
-
can be used for fully or
partially penetrating wells in unconfined or confined aquifers
-
water levels can enter the
screen
-
formation storage is ignored
-
requires graphical
interpretation for select constants
-
based on estimated radius of
influence of the well over which the perturbation is dissipated
3) Cooper et al. (1967)
-
based on heat flow analogy
similar to the Theis equation
-
designed to function in confined
aquifers with a fully penetrating well
-
storage coefficient can be
estimated
-
graphical curve matching method
There are several other methods
of analyzing slug tests. Many aquifer test analysis programs,
such as AquiferWin32, include these, and many others.
Back to Slug Tests
|
There are many resources
available for more information on slug tests. For this newsletter the following
textbooks were used:
Bear, J. (1972).
Dynamics of Fluids in Porous Media. Published by American
Elsevier Publishing Company Inc., New York.
Driscoll, F.G. (1986).
Groundwater and Wells, Second Edition. Published by
Johnson Screens, Minnesota.
Fetter, C.W. (1994).
Applied Hydrogeology, Third Edition. Published by
Prentice-Hall Inc., New Jersey.
Return to top of
Newsletter
|
AQUIFERWIN32
Click here to download a demo of AquiferWin32
Click here for the best price on AquiferWin32
|
AquiferWin32 is capable of
analyzing both single well tests and large scale pumping tests.
It contains a large number of solutions for each test type, including
those discussed in the technical note on slug tests. Split into
their respective categories, the solutions available are:
Slug Test Analysis:
Pumping Test Analysis:
Step Test Analysis:
Model Solutions:
-
Theis (1935)
-
Hantush (1960)
-
Hantush and Jacob (1955)
-
Neuman (1972)
-
WinFlow
-
WinTran
|

What makes AquiferWin32 different from other pumping
test Analysis Programs?
1. Ease of Use
2. Purchase Select Solutions
3. First order derivative curves
4. Full Featured Modelling Environment
5. Presentation of Results
Return to top of
Newsletter
|
|
|
1. Ease of Use
AquiferWin32 has a
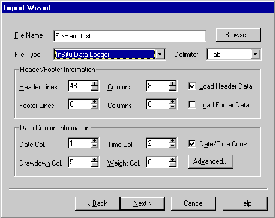
wide variety of data importing methods to make data entry convenient,
and the new import wizard makes data entry even easier. In
addition, AquiferWin32 does not require defining wells, you
simply need to import or enter the time/drawdown data into the
spreadsheet, fill in the radial distance and pumping rate and go!
The units are conveniently displayed in the title of the spreadsheet
columns, and AquiferWin32 provides a flexible unit
conversion calculations. The tab views employed in AquiferWin32
makes it easy to switch across the various graphs and data sets.
Return to AquiferWin32
|

Click here to enlarge
picture |
|
|
2. Purchase Select Solutions
One of the things that sets AquiferWin32
apart from other aquifer test analysis programs is that you can
purchase the solutions you require at that time, and then upgrade
later!
Return to AquiferWin32
|
|
|

Click here to enlarge picture
|
3. First Order Derivative Curves
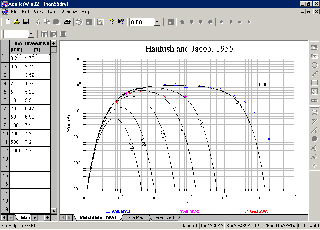
AquiferWin32 has a full
implementation of derivative analysis, which can significantly improve
the analysis of and aquifer test. Manual curve matching can be
done to optimize the match and accurately reduce the data.
Return to AquiferWin32
|
|
|
4. Full Featured Modelling
Environment
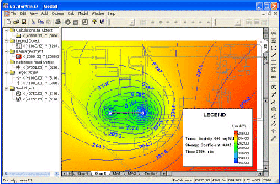
AquiferWin32
includes analytical solutions into a full featured modelling
environment that can produce contour maps of hydraulic head and
drawdown, color floods of head or drawdown, and particle tracking.
The inclusion of WinFlow and WinTran further expands these
capabilities.
Return to AquiferWin32
|

Click here to enlarge
picture |
|
|

Click here to enlarge
picture |
5. Presentation of Results
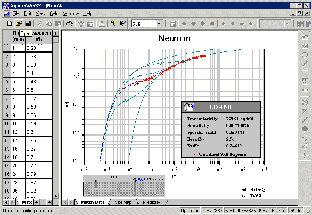
AquiferWin32
includes a wide variety of choices for editing the presentation of
your results to get the effect you want. You can create a site
map to plot well locations over a basemap, and the graphs are
customizable with respect to legends, printed headers and footers,
symbol control, and other features. The Object Linking and
Embedding (OLE) features allow the graphs created in AquiferWin32
to be copied to the Windows clipboard and then imported as pictures
and metafiles to documents produced in Microsoft Word and Wordperfect.
The graphs can also be exported to AutoCAD DXF files, Surfer files,
etc..
Return to AquiferWin32
|

