HYDRAULIC HEAD
In last month's newsletter
(Vol. 5 No. 3) we discussed Darcy's Law, which includes hydraulic
head. This month we will discuss the following about hydraulic
head and it's properties:
What does hydraulic head
represent?
What is the equation for hydraulic
head?
Does the equation for hydraulic
head equal the total energy of a groundwater system?
How do I determine hydraulic head
in the field?
Why is hydraulic head important?
Back to top of
Newsletter
What does
hydraulic head represent?
Hydraulic head is a measurement of the total
mechanical energy per weight of the groundwater flow system. In
other words, it is the fluid potential for flow through porous media.
It is predominantly comprised of pressure and elevation heads.
Back to Questions
What is the
equation for hydraulic head?
The equation for hydraulic (h) head has two
components; elevation head and pressure head.
h = z + hp
where:
z = elevation of the fluid above a reference
elevation (L)
hp = pressure head (L), calculated
by:
hp = P/ρg
where:
P = pressure (M/LT2)
ρ = density of fluid (M/L3)
g = acceleration of gravity (L/T2)
For example, in the given scenario hydraulic
head would be calculated as follows:

Notice how we don't have to
calculate hp
in this case and how we can determine it directly in the field.
Back to Questions
|
Does the equation for hydraulic head equal the
total energy of a groundwater system?
This is a tricky question.
The value calculated for hydraulic head is representative of the total
energy, however it is not the exact value. This is because the
derivation of the total energy of a groundwater flow system also
includes a term for kinetic energy. Kinetic energy represents
the energy obtained from the movement of the water (Newtonian physics:
a body in motion tends to remain in motion). The equation for
total mechanical energy of a groundwater flow system is:
Etm = (v2/(2g))
+ z + hp
where v = velocity (L/T)
g = acceleration of gravity(L/T2)
z = elevation of the fluid (L)
hp
= pressure head (L)
The equation for hydraulic head
does not include the kinetic energy term because the velocity of
groundwater flowing in porous media under natural hydraulic gradients
is very low, and hence the value for kinetic energy is significantly
smaller than the elevation and pressure head, and can be safely
ignored.
Back to
Questions
|
How do I determine hydraulic head in the field?
Hydraulic head can be determined
by measuring the depth of the water table in a groundwater well,
usually a piezometer. A piezometer is a non-pumping well,
typically with a small diameter and a short well screen through which
water can enter. A piezometer nest is a group of two or more
piezometers which are set very close to each other but are screened at
different depths. The use of a piezometer nest is an excellent
way to determine the vertical hydraulic gradient (vertical change in
hydraulic head) at a location.
When a piezometer is installed
there is some information about it that needs to be recorded for
determining hydraulic head. The depth of the piezometer (i.e.
depth to the screened section) and the elevation at the surface are
two examples of data that may be needed for calculating hydraulic
head.
The following example
illustrates how hydraulic head (and other related parameters) would be
calculated from the depth of a water table in a piezometer:
The data below were collected
from a piezometer nest:
| |
Piezometer A |
Piezometer B |
Piezometer C |
| Elevation at Surface (m.a.s.l.)* |
250 |
250 |
250 |
| Depth of piezometer (m) |
150 |
100 |
80 |
| Depth to Water Table (m.b.s.)** |
84 |
79 |
65 |
* meters above sea level
** meters below surface
Part i)
Calculate the hydraulic head
The hydraulic head is the
elevation of the water in the piezometer. It is calculated by
subtracting the depth to water from the surface elevation:
A: 250 - 84 = 166 m
B: 250 - 79 = 171 m C: 250 - 65 =
185 m
Part ii)
Calculate the pressure head at each well
The pressure head is the
height of the water above the depth of the piezometer. Hence
it is calculated by:
A: 150 - 84 = 66 m
B: 100 - 79 = 21 m C: 80
- 65 = 15 m
Part iii)
Calculate the elevation head at each well
The elevation head is the
height of the measuring point (i.e. the piezometer depth) above the
datum. In our case we have taken our datum to be mean sea
level, therefore the elevation head for each well is calculated as:
A: 250 - 150 = 100m
B: 250 - 100 = 150 m C: 250 - 80 =
170 m
Notice how the hydraulic head
is the sum of the pressure head and the elevation head!
Part iv)
Calculate the vertical hydraulic gradient between the piezometers
The hydraulic gradient is the
difference in hydraulic head divided by the vertical distance
between the two piezometers.
From piezometer A to B we
have:
171 - 166 = 5 m
difference in head
150 - 100 = 50 m vertical
distance
So, the vertical gradient is
5/50 = 0.1
And from B to C we have:
185 - 171 = 14 m difference
in head
100 - 80 = 20 m vertical
distance
So, the vertical gradient is
14/20 = 0.7
In both cases we see that the
gradient is downwards, meaning the water is flowing down through the
porous media.
Back to Questions |
Why
is hydraulic head important?
The analysis of virtually every
physical process involves a potential gradient. For example, an
electrical current flows through circuits from higher voltages to
lower. The same can be said for water flow, there is a potential
gradient that determines the direction of flow, and this potential
gradient is determined by hydraulic head. Hydraulic head is the
cornerstone of groundwater flow knowledge, a key component in
Darcy's law which describes fluid
flow through porous media. It is incorporated into every
groundwater flow model including the groundwater flow model,
Visual
MODFLOW,
and the pumping/slug test analysis programs, Aquifer Test, AquiferWin32 and Single Well Solutions.
Back to
Questions
There are several excellent
references available for more information on hydraulic head and it's
related properties. References used for this newsletter were:
Bear, J. (1972).
Dynamics of Fluids in Porous Media. Published by Dover
Publications Inc., New York.
Fetter, C.W. (1988).
Applied Hydrogeology 3rd edition. Published by Prentice
Hall, Inc., New Jersey.
Freeze, R.A. and J.A. Cherry
(1979). Groundwater. Published by Prentice Hall,
Inc., New Jersey.
|
|

|
AquiferTest,
AquiferWin32
& Single Well Solutions
Which one is for me?
|
 |
With such excellent selection
available for programs which perform pumping/slug test analysis, how
can you ensure that you are selecting the right program for your
needs?
If you do not have any data from
observation wells, and will be conducting an analysis based solely
on data from a single well,
Single Well
Solutions is an excellent option.
If you are not a frequent
analyzer of pumping/slug tests, or if you know exactly which solution
method you like to use,
AquiferWin32 may
be the program best suited for you.
If you often analyze
pumping/slug test data, are uncertain about, or like to experiment
with, different solution methods,
AquiferTest
would be a great program for use.
Back to top of
Newsletter
|
|
SINGLE WELL
SOLUTIONS
Single Well Solutions contains some
of the most popular analytical solutions for determining aquifer
conductivity and pumping well efficiency, and all from single well test
data. While other programs such as
AquiferWin32 and
AquiferTest also have
single well test capabilities, Single Well Solutions is the most cost
effective package for this type of well analysis.
The analytical solutions included in
Single Well Solutions are:
Slug Tests
-
Bouwer and Rice (1976)
-
Cooper et al.
(1967)
Constant Discharge
Variable Discharge
Step Drawdown
Constant Discharge Recovery
All of these solution methods come
from Analysis and Evaluation of Pumping Test Data by Kruseman and
deRidder (1990).
|
OTHER
FEATURES OF SINGLE WELL SOLUTIONS
1. Easy to import data
2. Ability to manage large data sets
3. Simple graph and table production
Return to top of Single Well Solutions
Return to top of Newsletter
|
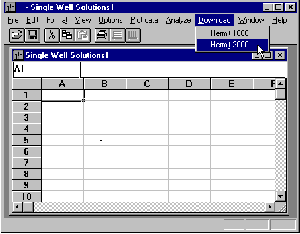
1. Easy to import data
Not only does Single Well Solutions include a
Wizard environment to guide you through the entire analysis procedure, but
with a wide variety of options for importing/inputting data this program
is easy to use.
Data can be downloaded directly from a datalogger,
it can be read into the spreadsheet from an ASCII file, and raw data can
be pasted into the spreadsheet from the clipboard.
Return to Single Well Solutions
Features
|
Click here
to enlarge picture |
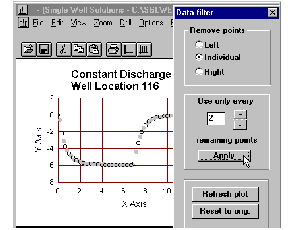
2. Ability to manage large data sets
Often times datasets from a datalogger may be
exceptionally large. Single Well Solutions contains a filter option
which can be used to reduce the size of the dataset by analyzing every
one, two... up to ten, data pairs. However, an unlimited number of
data pairs can be analyzed.
Return to Single Well Solutions Features
|
Click
here to enlarge picture |
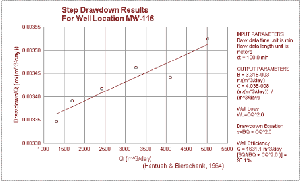
3. Simple graph and table production
The production of tables and graphs is simple
with this program. Tables of raw data can be created, in addition to
graphical results and summary tables. The Windows based environment
makes the production of these features easy, in addition to the use of the
Wizard environment.
Return to Single Well Solutions Features
|
Click here
to enlarge picture |
|
Return to top of
Newsletter
Download a demo of Single Wells Solutions
|
AQUIFERWIN32
AquiferWin32 is capable of analyzing
both single well tests and large scale pumping tests. What sets
AquiferWin32 apart from other pumping/slug test analysis programs is that
you can purchase the solutions that you require at that time, and upgrade
later. This enables you to pay for exactly what you want!
There are numerous solutions
available in AquiferWin32. Split into their respective categories,
they are:
|
Slug Test Analysis
Step Test Analysis
Model Solutions
|
Pumping Test Analyses
- Cooper and Jacob (1946)
- Theis (1935)
- Theis (Unconfined) (1935)
- Theis (Recovery) (1946)
- Hantush (1961)
- Papadopulos and Cooper (1967)
- Hantush (1960)
- Hantush and Jacob (1955)
- Hantush (1964)
- Neuman (1972)
- Neuman (1974)
- Moench (1984)
- Moench (1985)
- Moench (1997)
|
OTHER
FEATURES OF AQUIFERWIN32
1.
Easy to import data
2.
Ability to create first-order derivative type curves
3.
Full featured modelling environment
Return to top of AquiferWin32
Return to top of Newsletter
|
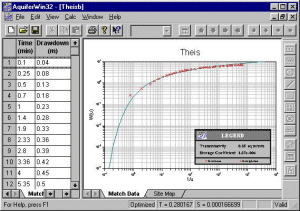
1. Easy to import data
The wide variety of data importing methods makes
data entry much more convenient. Data can be easily entered using
the new import wizard. In addition, you can still enter the data
manually, by cutting and pasting from spreadsheets, or by importing text
files. AquiferWin32 also contains one of the most versatile unit
conversion calculators available.
Return to AquiferWin32 Features
|
Click
here to enlarge picture |
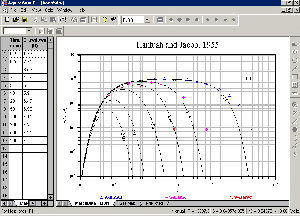
2. Ability to create first-order derivative
type curves
The analysis of pumping test data can be
significantly improved using a first-order derivative plot, and
AquiferWin32 gives you that ability. You can do manual curve
matching to the first order derivative type curve, allowing you to
optimize your match, and accurately reduce your data.
Return to AquiferWin32 Features
|
Click here to enlarge picture |
3. Full featured modelling environment
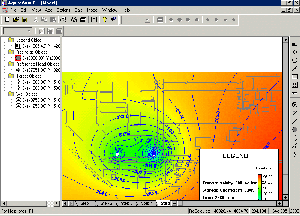
AquiferWin32 contains a modelling environment
that can produce contour maps of hydraulic head or drawdown, colour floods
of head or drawdown, and particle tracking with analytical groundwater flow
modelling. The inclusion of WinFlow and WinTran further expands
these capabilities.
Return to AquiferWin32 Features
|
Click here to enlarge picture |
|
Return to
top of Newsletter
Download a demo of AquiferWin32
|
AQUIFERTEST
AquiferTest is an easy-to-use,
versatile program for graphical analysis and reporting of pumping/slug
test data. It contains numerous solutions to analyze your data, and
gives you a wide selection of output options. Somewhat similar to
AquiferWin32,
AquiferTest has two purchasing options which determine which solutions are
included.
The solution methods available in
AquiferTest are:
|
Pumping Test Analysis
- Theis (1937)
- Cooper-Jacob Time-Drawdown
- Cooper-Jacob Distance-Drawdown
- Cooper-Jacob Time-Distance-Drawdown
- Walton (Hantush-Jacob)
- Neuman
- Moench
- Moench Fracture Flow
- Theis Steptest
- Cooper-Jacob Steptest
- Theis Recovery
- Hantush-Bierschenk Well Loss
- Specific Capacity
- Theis Prediction
- Jacob Correction Factor
|
Forward/Predictive Solutions
(only available in AquiferTest Pro)
- Theis
- Hantush
- Stallman (Barrier)
- Stallman (Recharge)
- Gringarten (Well Skin Effects)
- Papadopulos (Large Diameter Wells)
Slug/Bail Test Analysis
- Hvorslev
- Bouwer-Rice
- Cooper-Bredehoeft-Papadopulos
|
|
OTHER
FEATURES OF AQUIFERTEST
1.
Easy to import data
2.
Several data analysis features
3.
Versatile output selections
Return to top of AquiferTest
Return to top of Newsletter
|
1. Easy to import data
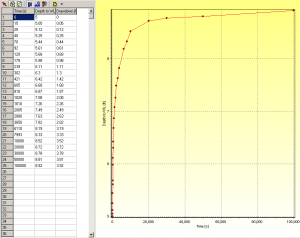
AquiferTest has a variety of methods for
importing data, including cutting and pasting from ASCII text files and
Excel spreadsheet files. In addition, a Microsoft Access database is
used to store and manage data, and the intuitive data entry forms makes
for fast and easy data entry and editing.
Back to AquiferTest Features
|
Click
here to enlarge picture |
2. Several data analysis features
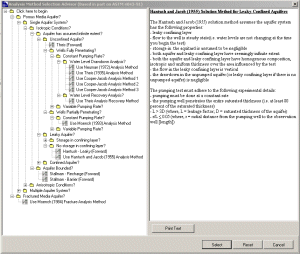
If you are not certain about what solution would
be appropriate for your data, the Method Selection Advisor available in
AquiferTest will help select a solution method based on your aquifer
conditions (based on ASTM standards). In addition, you can
simultaneously analyze data from several pumping tests, and use the
Pumping Test Planner to predict your data results, and help plan an
appropriate pumping test.
Back to AquiferTest Features
|
Click here to enlarge picture |
3. Versatile output selections
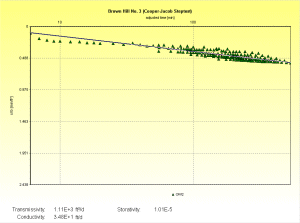
The map views, tabulated data and analysis graphs
can be printed with professional report layouts. You can also
customize the appearance of the graphs, and then export them to graphics
files (.bmp, .jpg, .wmf and .emf) for inclusion in reports, or for further
modifications.
Back to AquiferTest Features
|
Click here to enlarge picture |
|
Return to top of
Newsletter
Download a demo of AquiferTest
Questions? Write to
Support@GroundwaterSoftware.com |
|
GroundwaterSoftware.com is
brought to you by
Environmental Software Online, LLC
520 Chicopee Row, Groton, MA 01450 USA
Tel: (978) 448-5818 or (978) 772 4622 Fax: (978) 772-0595
E-Mail: info@groundwatersoftware.com
Groundwater Software can
be purchased and downloaded immediately. Choose fro |

