What's
New in Visual MODFLOW 3.1
MODFLOW-Surfact
pdf
|
Support for
MODFLOW-SURFACT MODFLOW-SURFACT
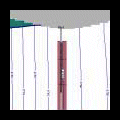
utilizes special numerical methods and powerful
solvers to avoid the solution convergence problems
caused by dry cells, to gracefully handle surface
ponding caused by excessive recharge, and to
redistribute well pumping rates from over-pumped cells
to underlying cells. MODFLOW-SURFACT also includes a
rigorous treatment of unsaturated zone flow processes
for simulating groundwater flow and soil vapor flow in
the vadose zone.
|
click to enlarge
|
Improved Model
Calibration Graphs
Visual MODFLOW v.3.1
includes many new features for evaluating and
interpreting the model calibration:
-
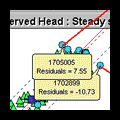
The
data points in the Calibration Scatter Graph can
now be linked to the map view in the main
Visual MODFLOW window. By clicking on a data
point in the graph, an info bubble will appear
with the well name, X and Y coordinates, and
the calculated and observed values. In addition,
the observation well associated with the
selected data point(s)
will also be highlighted in the map view
in the main Visual MODFLOW window. This new
feature makes it very easy
to quickly identify the location of the wells
associated with poorly calibration data.
-
The
data point symbols in the Calibration Scatter
Graph are now displayed according the model
layer where the observation points are
located (i.e. different symbol shapes and colors
for different model layers) allowing you to easily
identify the vertical location of the observation
point.
-
The
calculated model results for each grid cell center
are now interpolated to the well location
to provide a more accurate comparison between
the calculated and observed data at the
observation well.
-
A
Calibration Statistics Reports can be generated
for printing or pasting into a report document.
-
The
Calibration Statistics Report now includes the
Correlation Coefficient.
-
Preferences
settings allow you to set the number of decimals
for the Calibration Statistics and
Output Time values.
|
click to enlarge
|
Calibration
Residual Maps
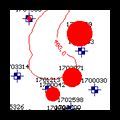
The Calibration Residual
Maps are used to display the calibration data values
at selected observations points using tags, or to
represent the residual values using color-filled
bubbles at selected observation point where the bubble
radius is scaled according to the residual value.
However, the options for controlling the appearance of
the tags and the bubbles were quite limited. This
latest version gives you complete control over the
color, size and content of the text in the tags, and
it allows you to control the color and scale of the
bubbles. In previous versions it was sometimes
difficult to effectively use the bubble plots because
the range of values was so high that it was difficult
to differentiate all but a few of the points. This
latest version of Visual MODFLOW allows you to
associate a min and max bubble size to a min and max
residual value such that all residual values above the
maximum value will be plotted using the same maximum
radius, regardless of the value.
|
click to enlarge
|
New Cell Inspector
Parameters
Several new parameters have been added to the Cell
Inspector to facilitate better understanding about the
model geometry and properties, and to help interpret
the modeling results. These new parameters include:
- Cell
top elevation
- Cell
bottom elevation
- Cell
thickness
- Specified
head (for head dependent boundary conditions)
- Conductance
(for head dependent boundary conditions)
- Flow
velocity in the X-direction
- Flow
velocity in the Y-direction
- Flow
velocity in the Z-direction
|
click to enlarge
|
Recharge Boundary Condition
Visual
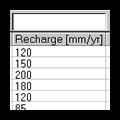
MODFLOW v.3.1 now allows you to assign descriptive
names to each Recharge zone and to assign Recharge
flux to grid cells in any layer of the model. This
allows you to use the Recharge boundary condition as a
specified flux boundary condition in layers other than
the top layer or the upper-most active layer.
|
Other
New Features:
Import Multiple
Bitmap Images for Site Maps
Multiple bitmap images can now be imported into a project and
georeferenced after the project has been initially created.
This allows you to have several different bitmap images for
representing different types of data. Bitmaps can also be used
simultaneously with ESRI GIS (.shp) files and AutoCAD (.dxf)
files.
GIS and
Database Support
ESRI GIS (.shp) files and database have become two of the main
sources of data for groundwater models, and Visual MODFLOW is
making it as easy as possible to incorporate this data
directly into your model. Version 3.1 now allows you to import
pumping well data and observation well data directly into your
model by mapping the data required by the model to the fields
stored in the ESRI GIS shape or MSAccessTM database files. In
addition, Visual MODFLOW easily accommodates missing
information with optional "fill values" and has
built-in data validation checks to prevent you from importing
erroneous or corrupted information.
Model Appearance Options
Visual MODFLOW v.3.1 now includes options to control the
display options for many more model attributes including:
 Size and color of the well symbols and labels
 Color of dry cells, inactive flow cells and inactive transport
cells
 Color of cell areas above the water table in cross-section
 Hide/show vertical gridlines in cross-section view
3D Visualization
VMOD 3D-Explorer has been dramatically improved with the
addition of several new visualization features and many
improvements to existing features. Some of the more
significant improvements include:
Synchronization of output
times for flow and transport simulations in order to
simultaneously animate the changes in
head and concentrations.
 Color-filled contour maps display a uniform color fill between
contour lines, where the color changes
in a step-wise manner from one contour interval to the next.
This provides a more dramatic
representation of the change in values than the smooth
gradational color change shown with
the color map objects.
 Transparent contour line labels and multiple contour line
labels with a user-defined minimum distance
between each label.
 A more robust algorithm for creating AVI animation files.
 An auto-rotate feature for automatically rotating the image
around selected axes.
Click here
for detailed information on Visual
MODFLOW
|

 VMOD
3.1
 .gif)


